After training completes, Custom Vision will display comprehensive performance metrics to help you understand how well your object detection model is performing.
Training Results and Metrics
Wait for the training to complete. Custom Vision will evaluate performance metrics such as:
- Precision
- Recall
- Mean Average Precision (mAP)
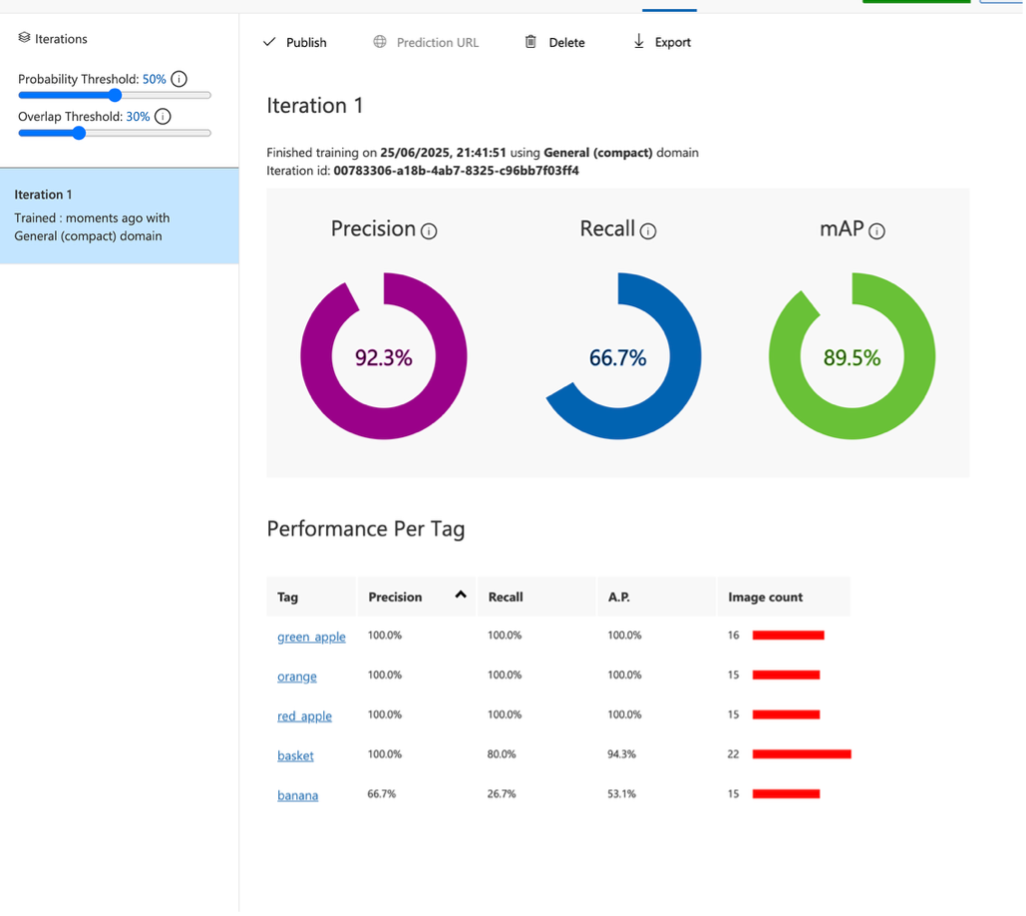
Object detection performance dashboard showing precision, recall, and mAP metrics for each detected object class
This performance summary shows the object detection model achieved high precision (92.3%) and mean average precision (mAP) of 89.5%. However, the recall was lower at 66.7%, indicating that the model failed to detect all objects present in the images.
Looking at the breakdown per tag, banana performed poorly, with a precision of only 66.7% and a recall of just 26.7%. This likely stems from the fact that bananas frequently appear in bunches, often overlapping or partially obscuring one another.
Understanding Thresholds
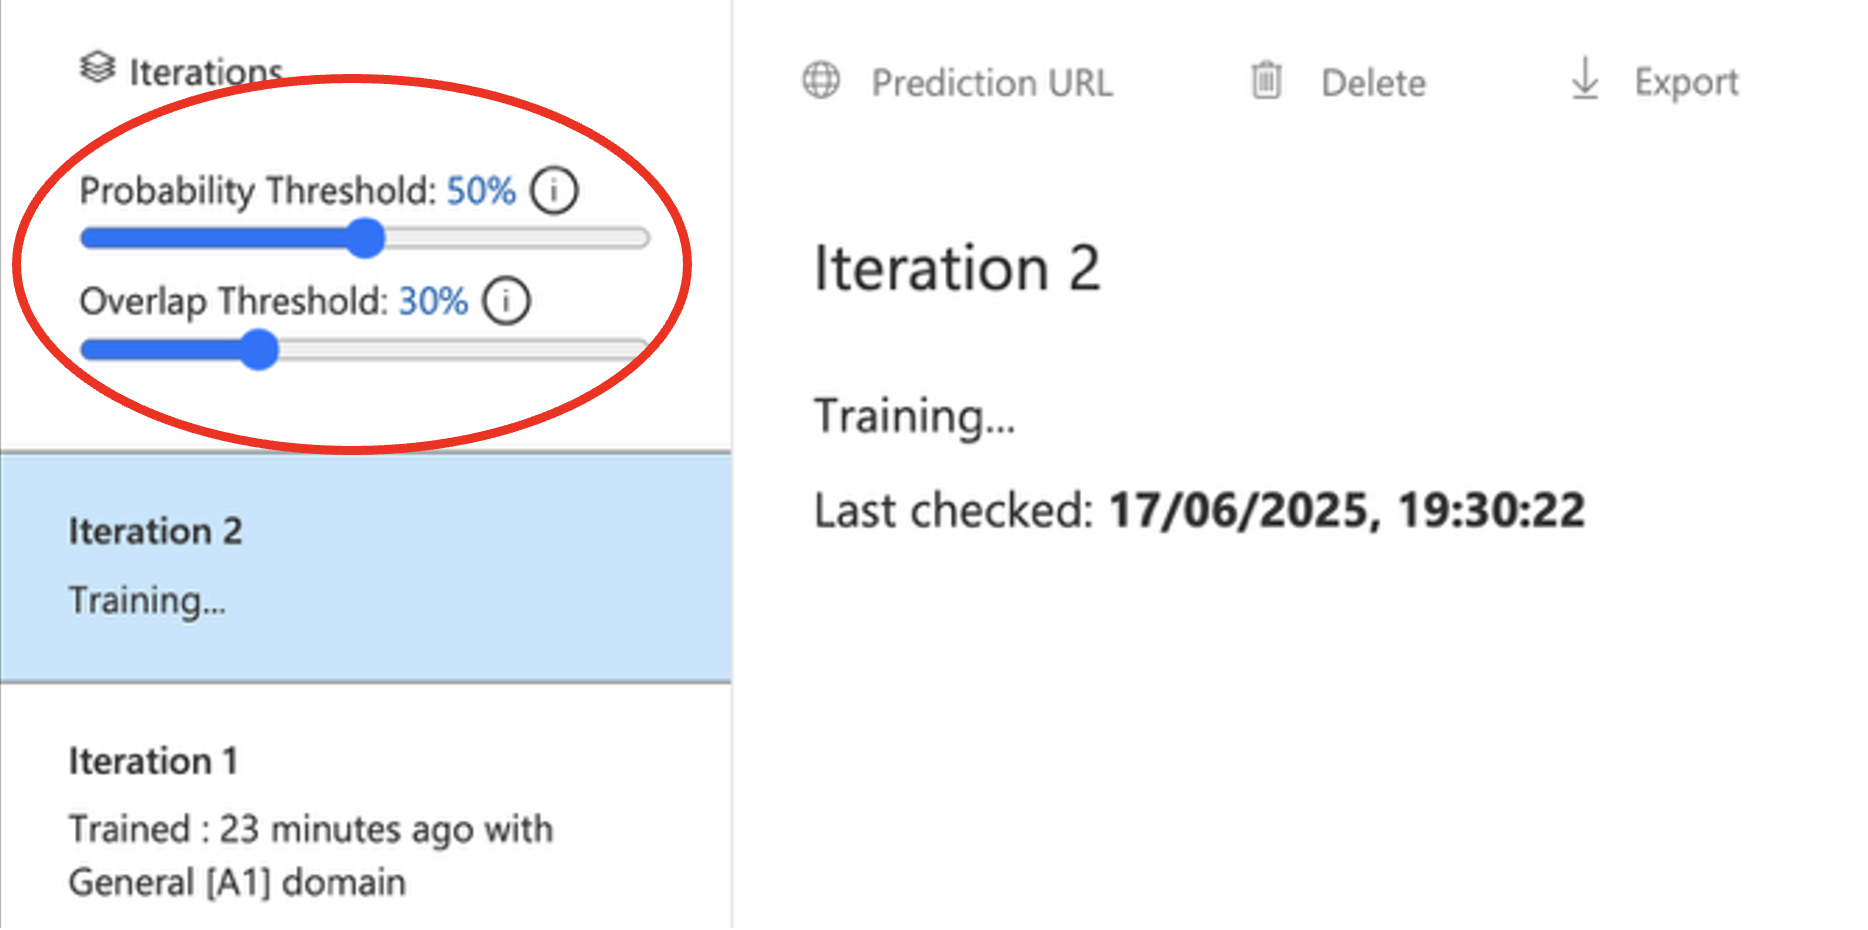
Custom Vision threshold controls - these sliders affect how performance is evaluated but not how the model is trained
On the leftmost pane, you'll see two important sliders:
- Probability Threshold: Determines whether a predicted object is returned based on its confidence score
- Overlap Threshold: Sets the minimum required overlap between the predicted bounding box and the manually labeled box for a prediction to count as correct
These do not affect how the model is trained, but they do influence how its performance is evaluated once training is complete.