Probability Threshold
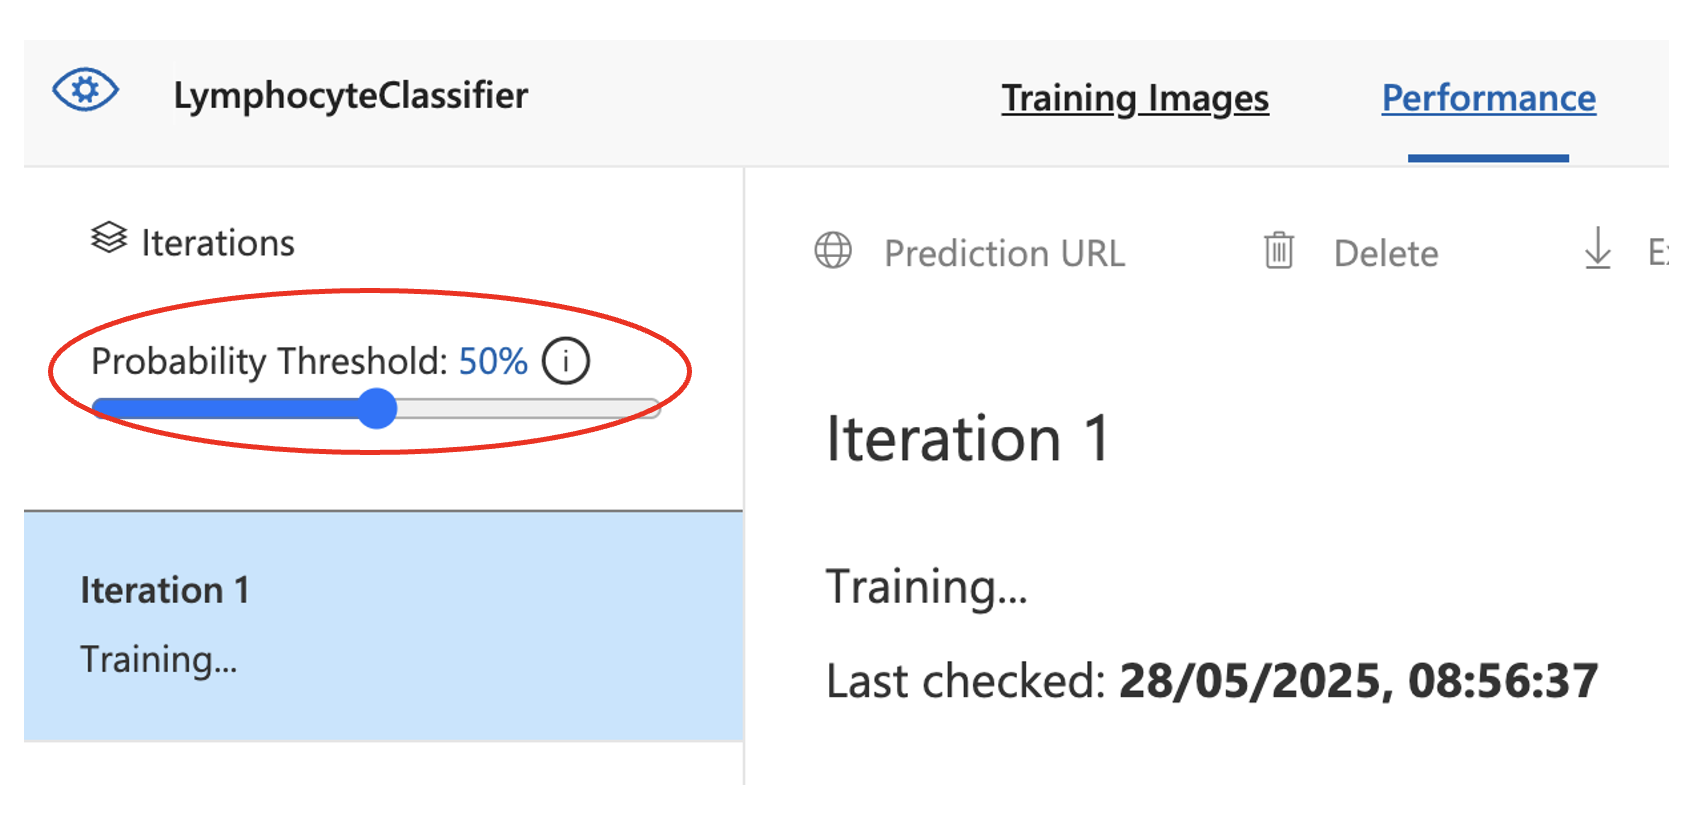
Probability threshold slider in Custom Vision - this controls the confidence cutoff for making predictions
You will see a Probability Threshold slider appear on the left. The Probability Threshold is the cutoff used to decide whether to return a classification or not.
During inference (not training):
- If the highest score meets or exceeds the threshold, the class is returned as a prediction
- If the highest score is below the threshold, the model may return "no prediction" (or undefined)
Example:
- Threshold = 50%: lymphocyte_present at 82% → predicted class is lymphocyte_present
- Threshold = 90%: Same result might not be returned, because 82% < 90%
Changing the threshold helps you balance:
- Sensitivity: Lower thresholds make the model more likely to classify, even if it's uncertain
- Specificity: Higher thresholds make the model more conservative, avoiding false positives
Interpreting Performance Metrics
When your Custom Vision model makes a prediction on an image, it calculates a confidence score (or probability) for each class.
Once training is complete, you'll see a dashboard with metrics including:
- Accuracy
- Precision
- Recall
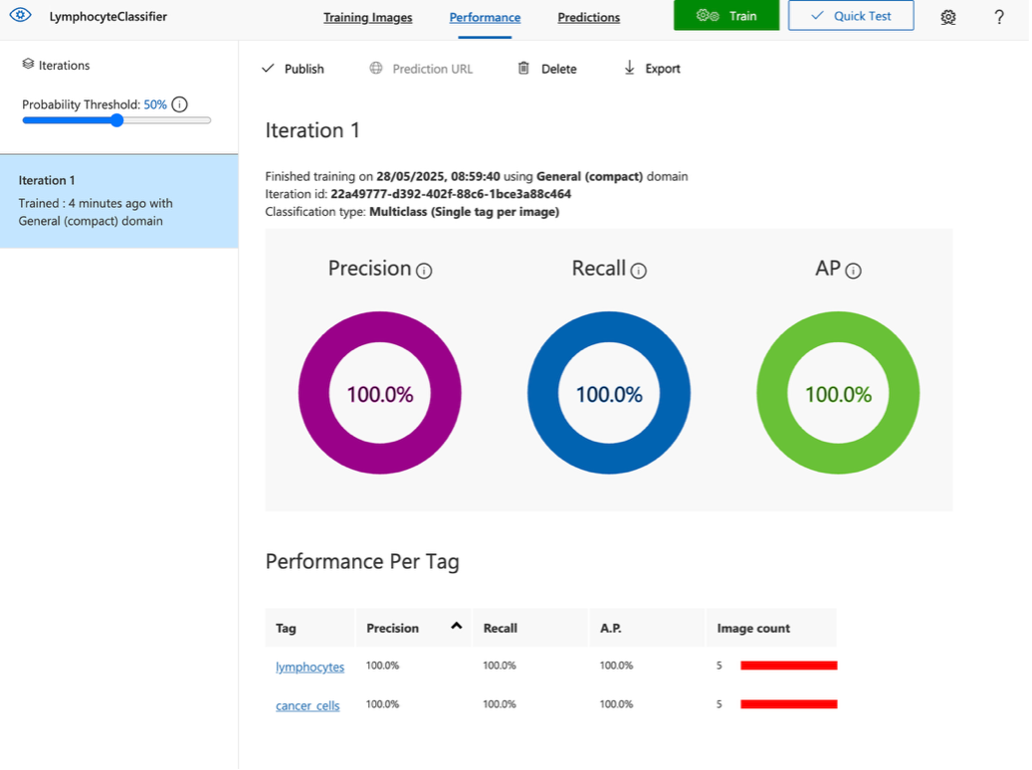
Performance dashboard displaying model evaluation metrics with precision (purple), recall (blue), and average precision (green) scores
The Performance Dashboard evaluates how well your model is classifying images:
Precision
Of the tags that you provided the model with, this tells you how likely it is that its tag predictions are correct. This metric focuses on the model's accuracy in terms of predicting positives. In this example, the model's precision is 100%, meaning it made no false positive predictions.
Recall
This shows how many of the actual examples from each class the model correctly identified. In this example, the model's recall is also 100%, meaning it missed no true examples.
AP (Average Precision)
A summary score that balances precision and recall across the threshold range. A score of 100% indicates perfect confidence and separation between the two classes.