In our first example, we are going to use Custom Vision to perform a multi-class classification (MCC), whereby an entire image is assigned a single tag depending on the predominant features present. In a multi-class setup, each image is assumed to belong to exactly one category. This structure makes MCC especially suitable when classes are mutually exclusive and clearly defined, such as distinguishing between types of cells, species or material categories.
At its core, MCC works by learning to recognise patterns in labelled images. During training, the model analyses examples from each class, learning the visual characteristics that distinguish one from another. Once trained, it evaluates each new image and produces a set of probability scores across all possible classes. The class with the highest score is returned as the model's prediction. The model does not consider the possibility that multiple labels might apply to the same image: instead, it selects the single most likely category based on its learned decision boundaries.
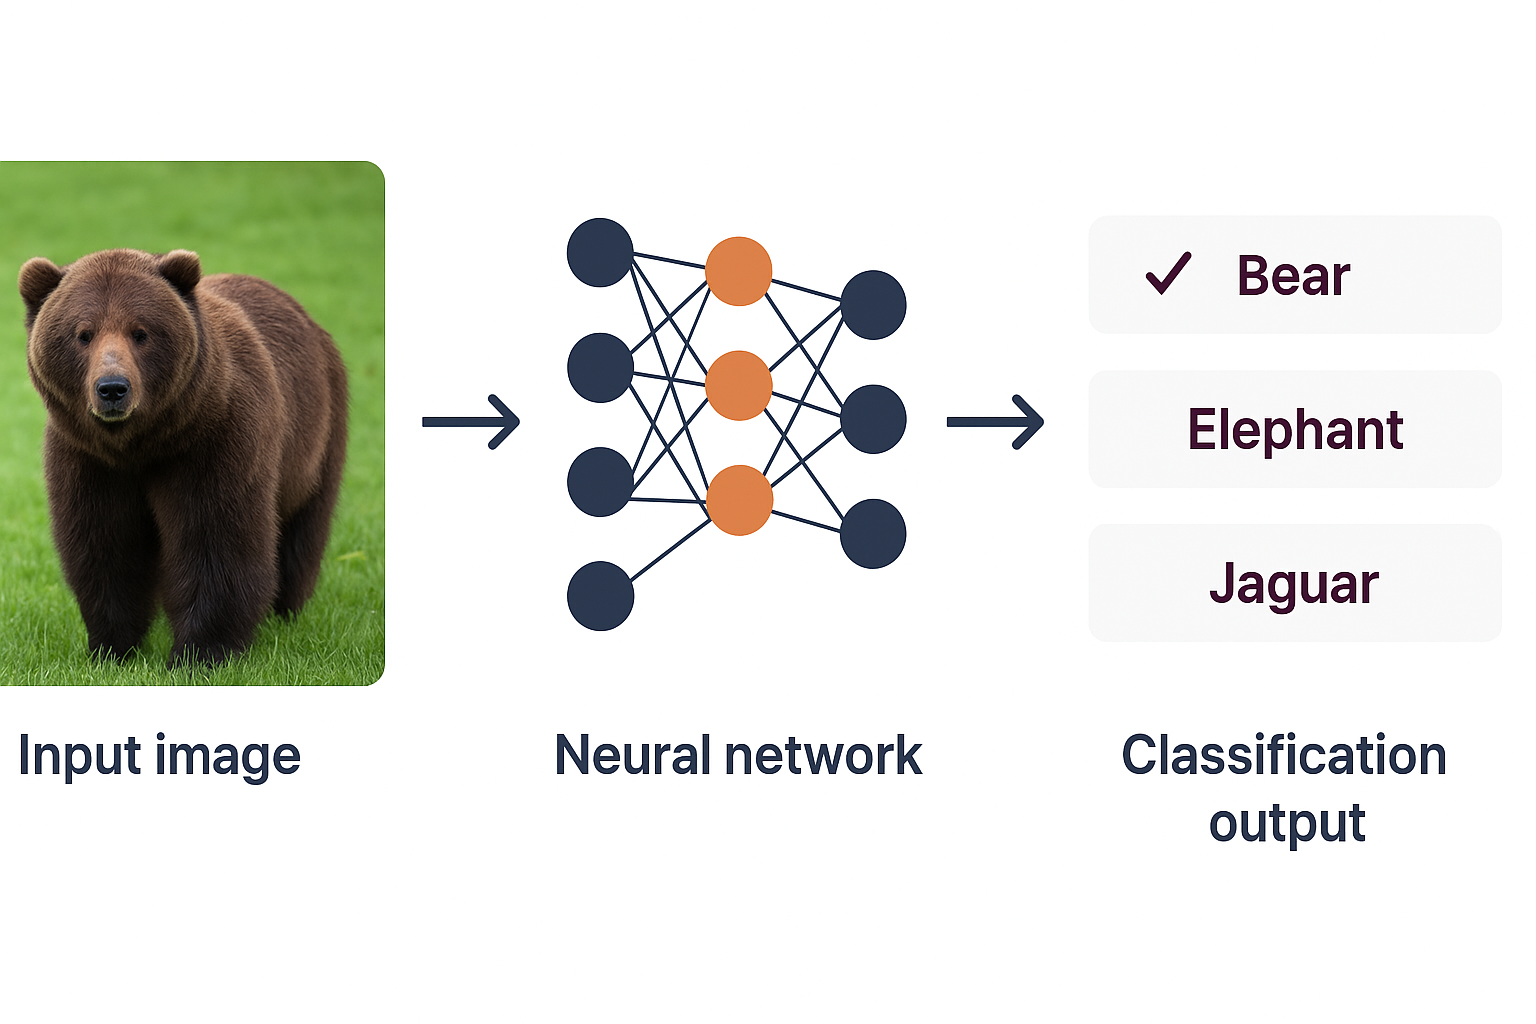
Multi-Class Classification (MCC) concept.
This approach is highly useful in research contexts where categorical labelling is clean and where the task involves sorting images into exclusive groups. In biomedical imaging, for instance, multi-class classification can be used to categorise tissue regions into specific cell types. In materials science, it might be used to classify images of different crystal structures. MCC provides a straightforward, interpretable framework for organising large volumes of image data, enabling faster analysis, filtering and downstream decision-making.
Multi-Class Classification Tutorial Video
The tutorial video below summarises the workflow and examples used in the multi-class classification section of our Custom Vision resource. Please consider its use as a supplement to the written materials, which give more depth and context.
Example: Lymphocytes & Cancer Cells
For this example, we'll work with high-resolution histopathology images of colorectal tissue. These images contain a mixture of cell types, including:
- Lymphocytes - small, round, darkly stained immune cells often clustered together
- Cancer cells - typically larger, irregularly shaped epithelial cells with hyperchromatic nuclei forming dense glandular structures
The goal is to train an AI model to recognize and distinguish between regions containing lymphocytes and those containing cancer cells, using cropped examples taken from larger histological images. In applications where a medic may want to narrow down upon a large number of histological images for potential cancer patients, Custom Vision's multi-class classification workflow provides a fast, intuitive way to filter a dataset for subsequent expert review.
Dataset Information
We will begin working with real histopathology data from the TCGA-CRC-DX dataset: a publicly available, high-resolution image set derived from hematoxylin and eosin (H&E) stained slides of colorectal cancer tissue. The dataset was created by tiling whole-slide images (WSIs) of tumour tissue from colorectal cancer cases in The Cancer Genome Atlas (TCGA). These WSIs were annotated to identify tumour regions and cropped into non-overlapping tiles of 512×512 pixels at a resolution of 0.5 µm per pixel: ideal for cellular-level image classification.
Each image tile comes from a tumour region and may contain:
- Cancer cells: large, irregular, and densely clustered epithelial cells with hyperchromatic nuclei
- Lymphocytes: small, round, darkly stained immune cells that often cluster near tumour margins or infiltrate the tumour stroma
- Background elements like connective tissue, mucus, or other non-tumourous structures
The two image tiles below each contain a mixture of cell types, with the left image clearly showing an abundance of cancer cells, and the right image showing an abundance of lymphocytes.
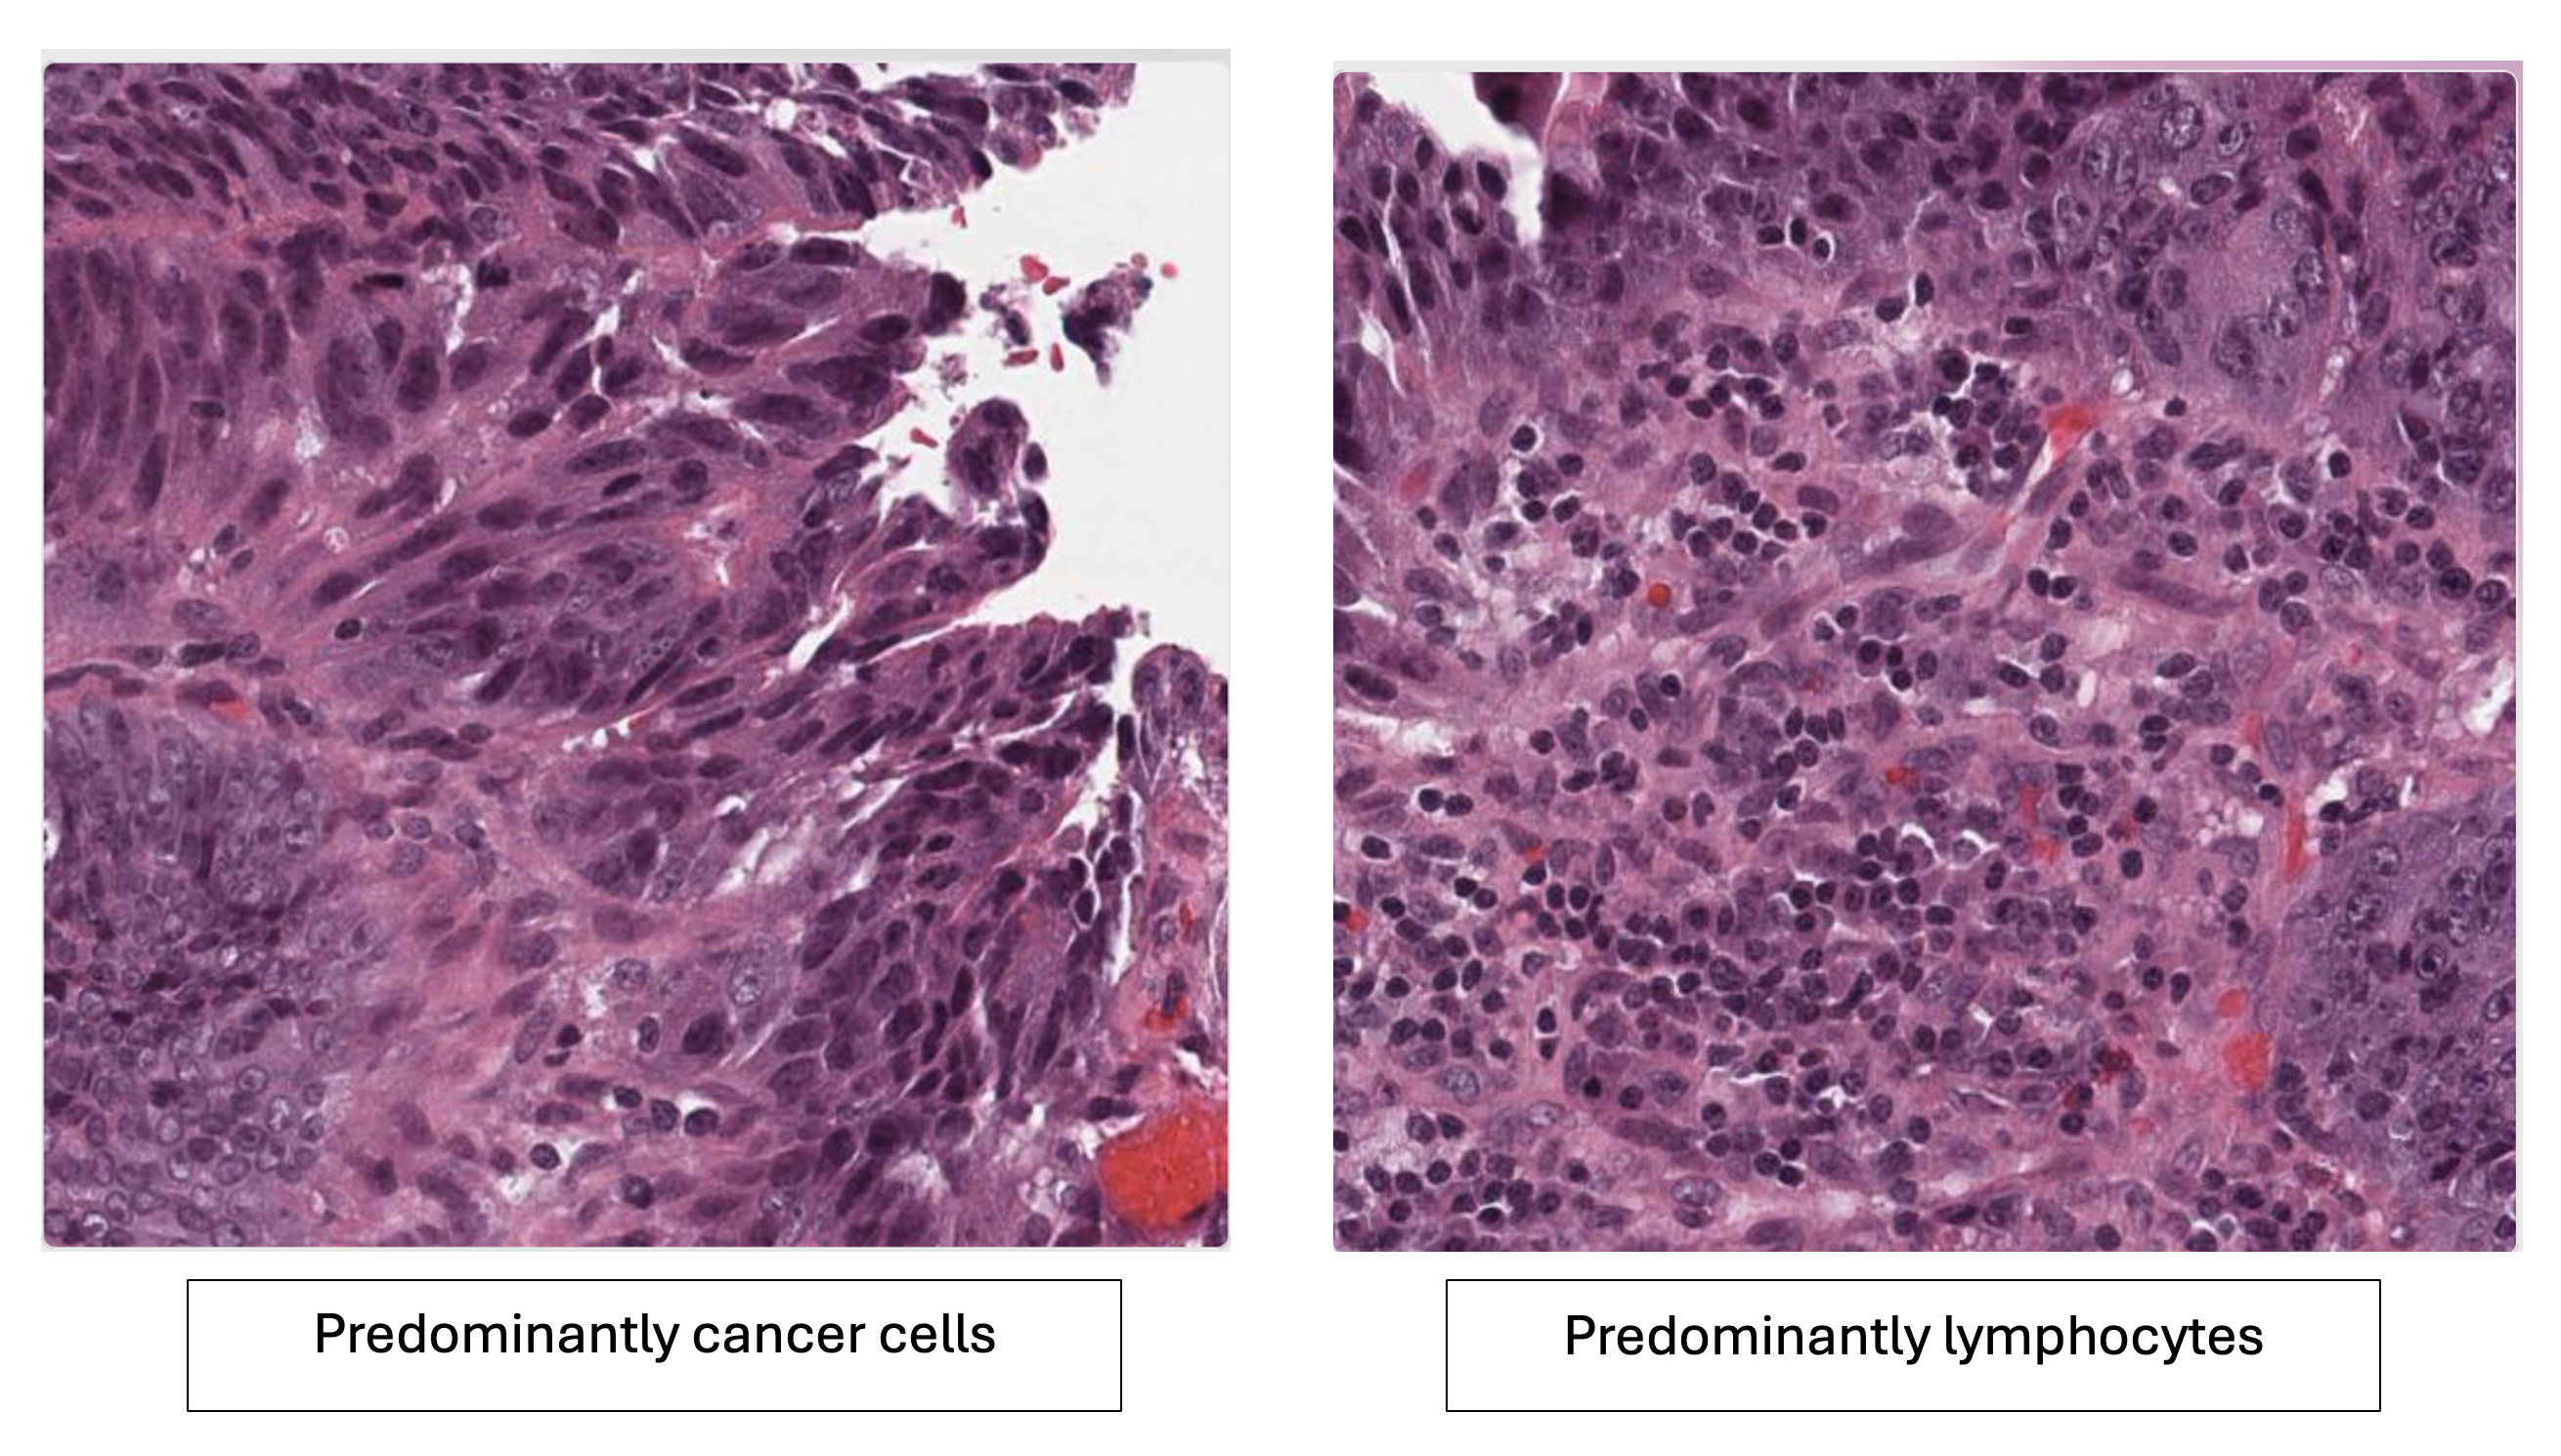
Histopathology comparison: Left image shows predominantly cancer cells with irregular, densely clustered epithelial structures. Right image shows predominantly lymphocytes with small, round, darkly stained immune cells.
We'll begin by working with image tiles from this dataset. You can download sample data from the scryptIQ GitHub repository in the path ai_services/cancer_dataset.